
Market Pulse: October 2026
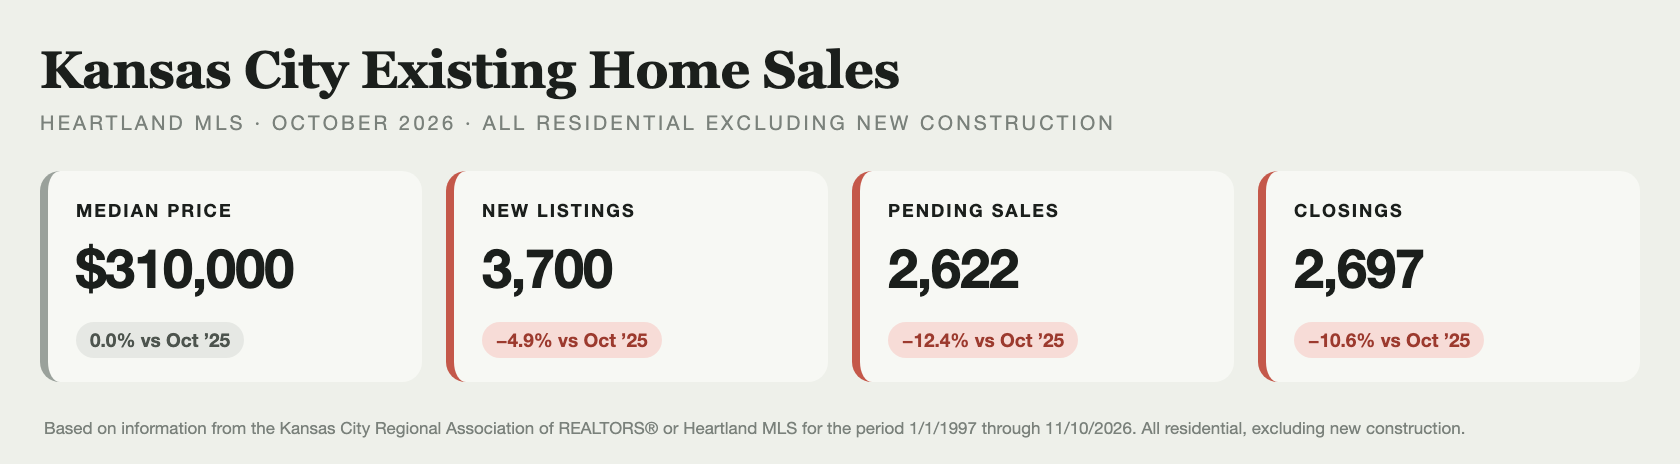
Kansas City's existing-home market slowed further in October. New listings, contracts written and closings all finished below October 2025, and contracts and closings posted their steepest declines of the year. The median resale price was $310,000, flat with last October for the first time since 2023.
In this article (9)
Market Pulse: October 2026
Prices: Flat with last year for the first time since 2023
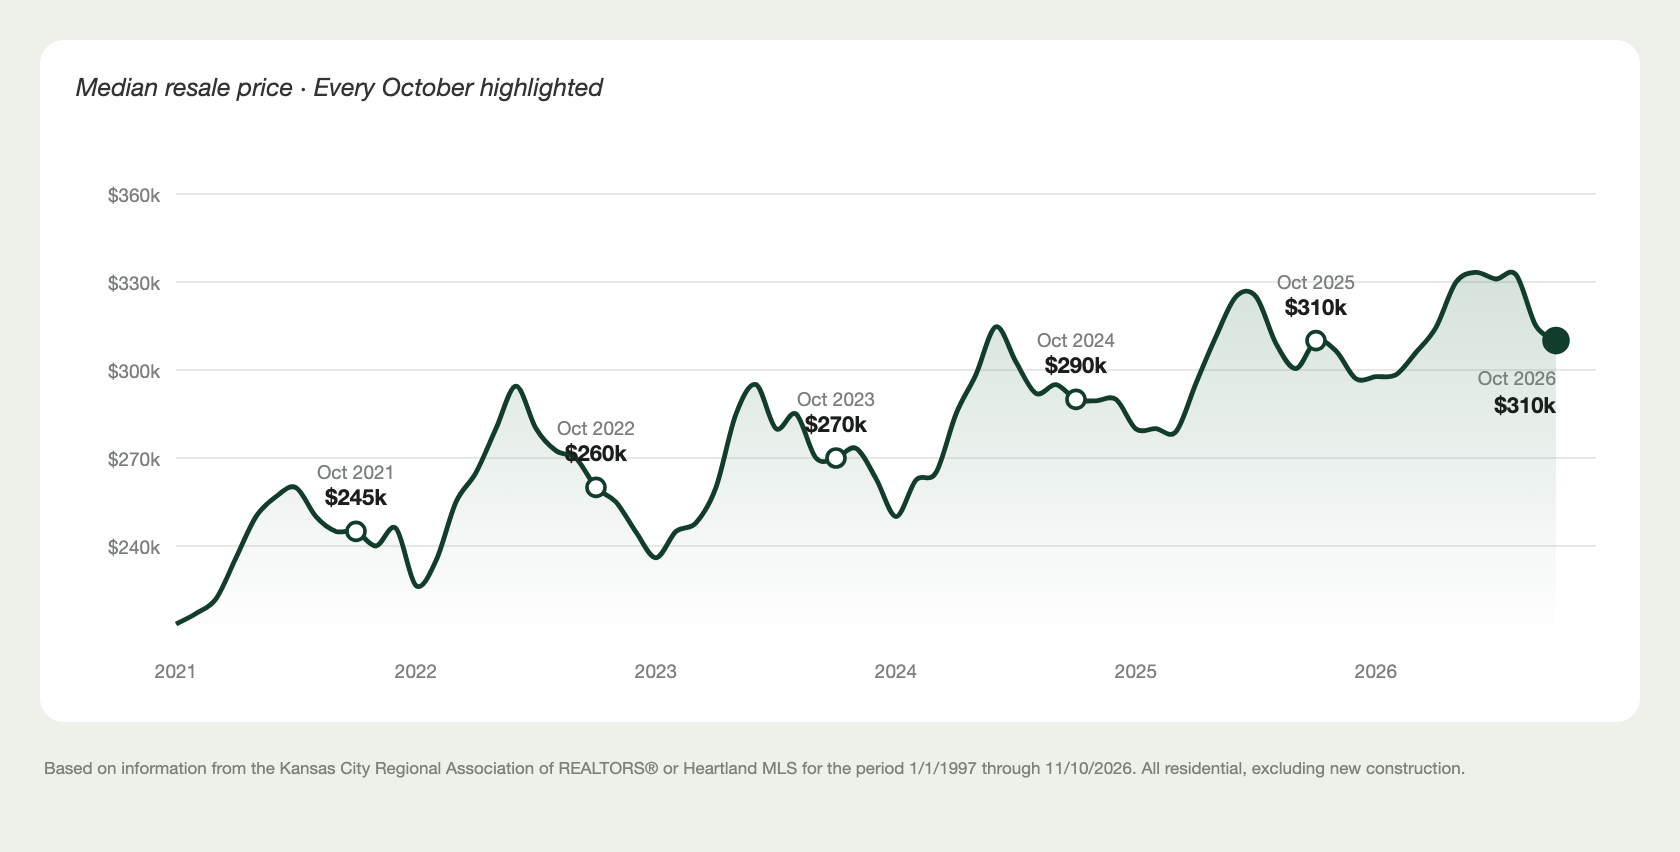
Median resale price: $310,000
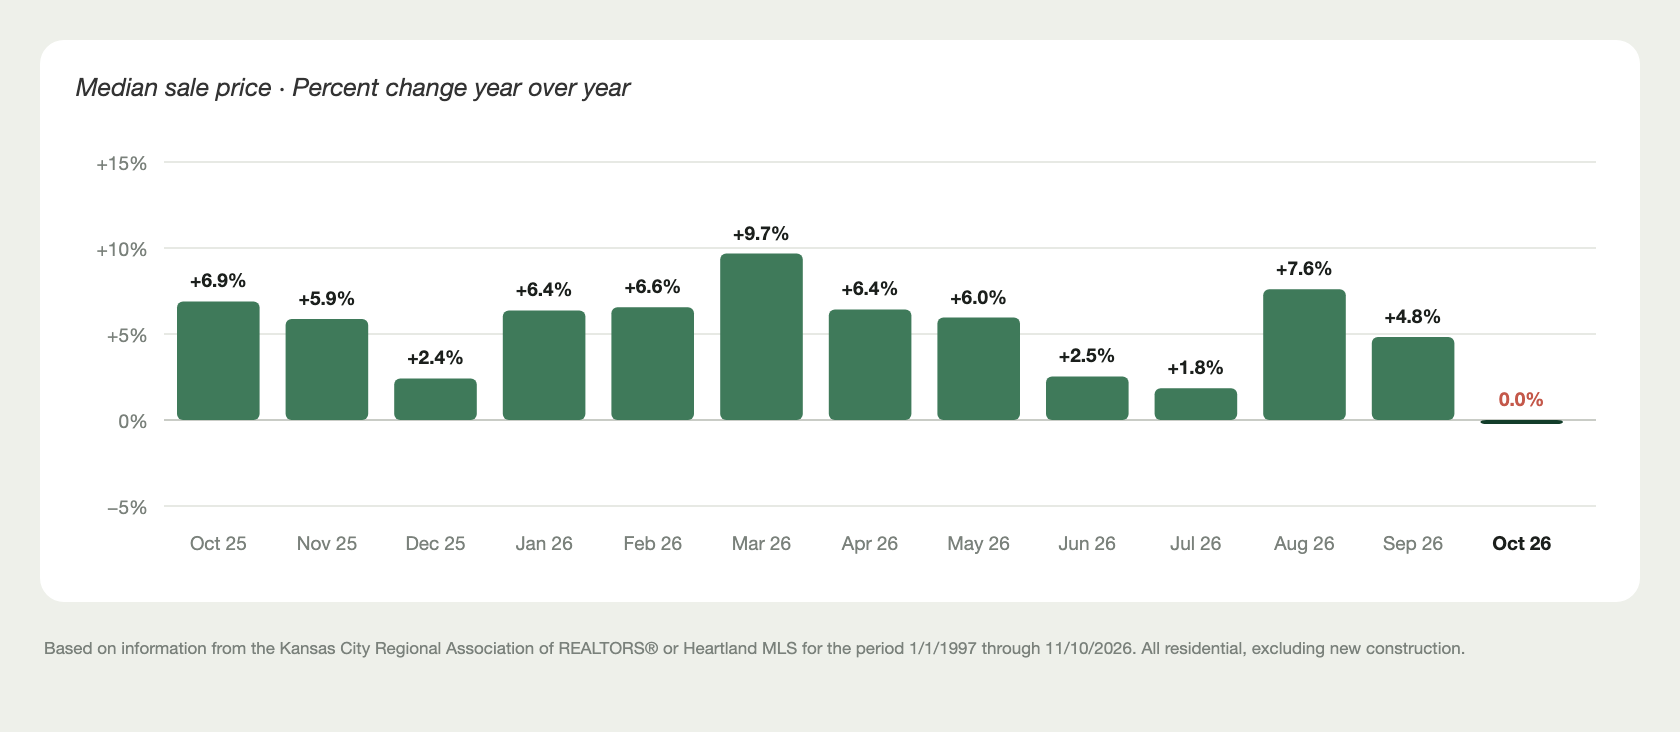
Year over year: 0.0%
The median resale price in October was $310,000, exactly where it stood in October 2025. That ends a long run: from August 2023 through September 2026, every month finished above the same month a year earlier, and as recently as August the gain was 7.6%. September's gain narrowed to 4.8%, and October's disappeared.
Flat is not falling. The median is down from $315,000 in September and from the June peak of $333,255, but a step down into fall happens every year. What changed is that this fall's step was large enough to erase the year-over-year gain. Over five years the picture is still one of strong appreciation: the October median was $245,000 in 2021, so today's price is 26.5% higher.
New Listings: A fourth month below last year
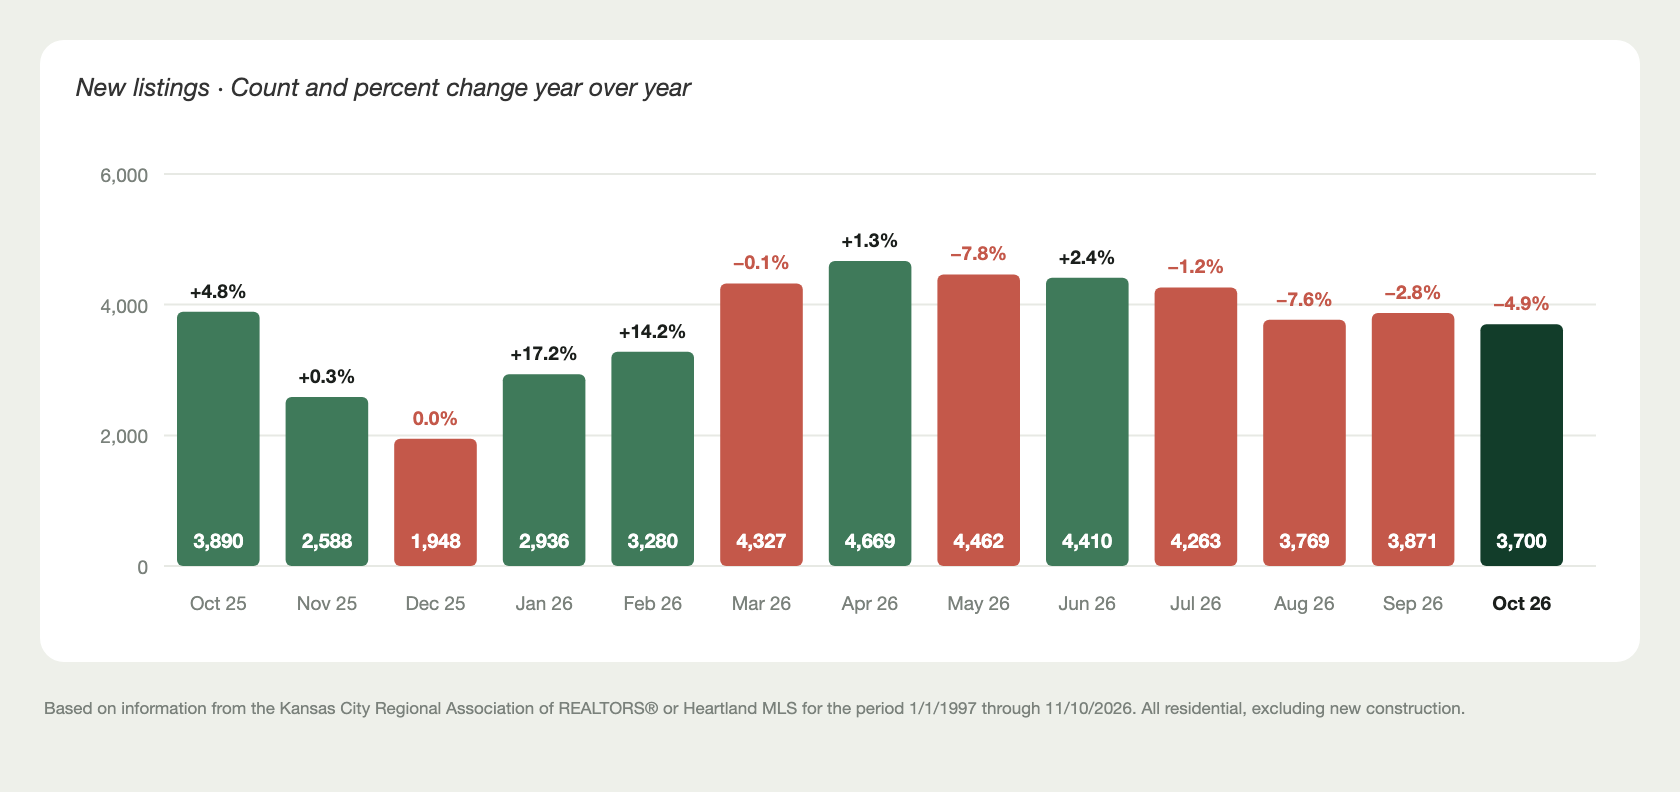
New listings: 3,700
Year over year: −4.9%
Fewer homes came to market than in October 2025, the fourth month in a row below last year. September had hinted at a turn, when listings rose from August against the usual seasonal pattern. October did not build on it. Listings fell by about 170 homes from September, compared with a drop of about 90 over the same stretch last year.
Demand: The steepest declines of the year
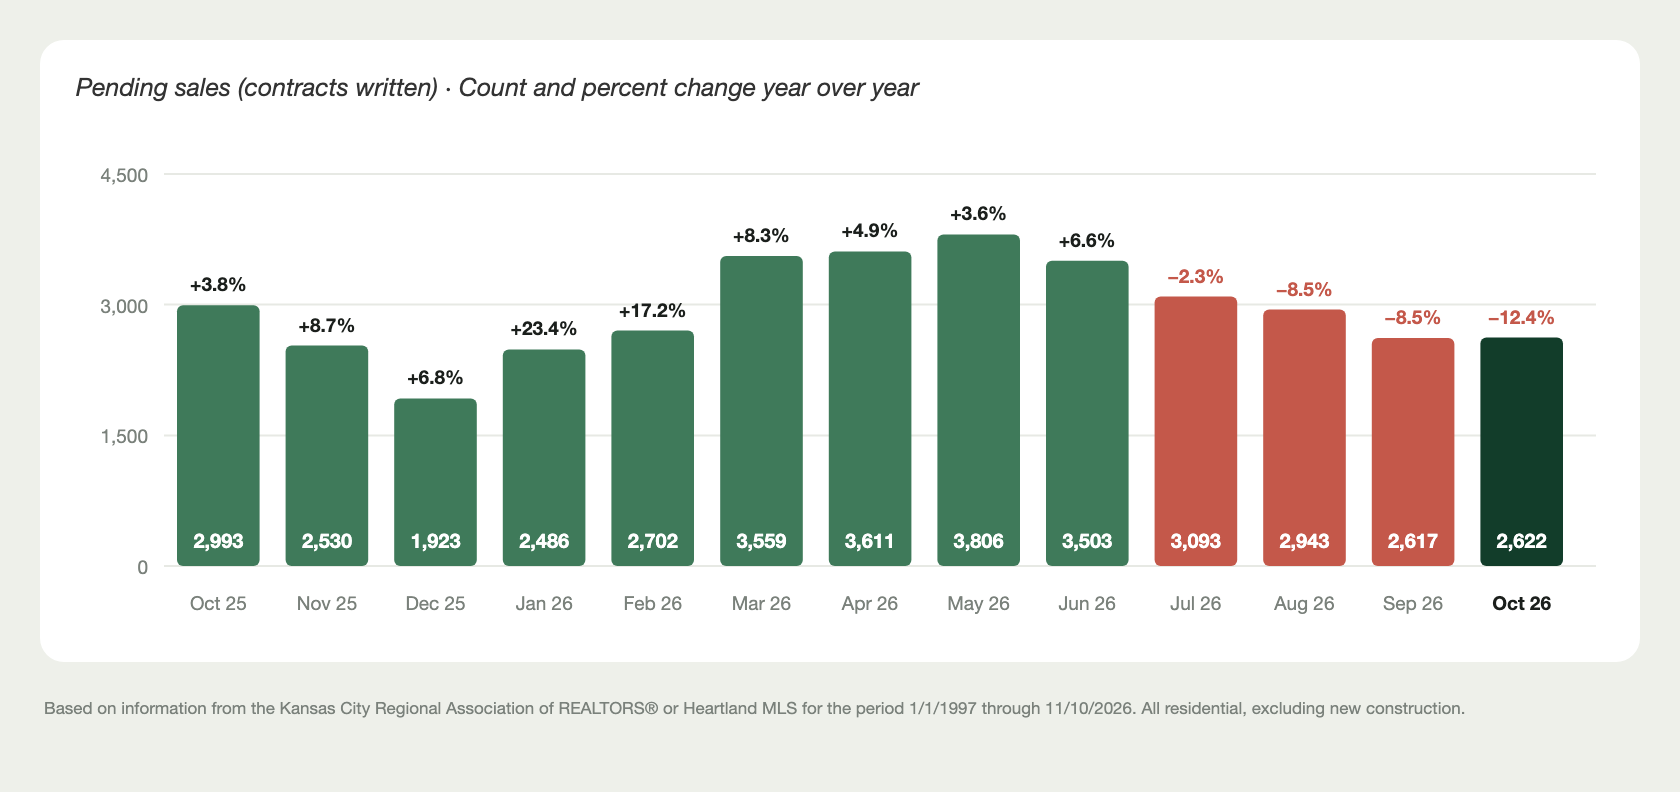
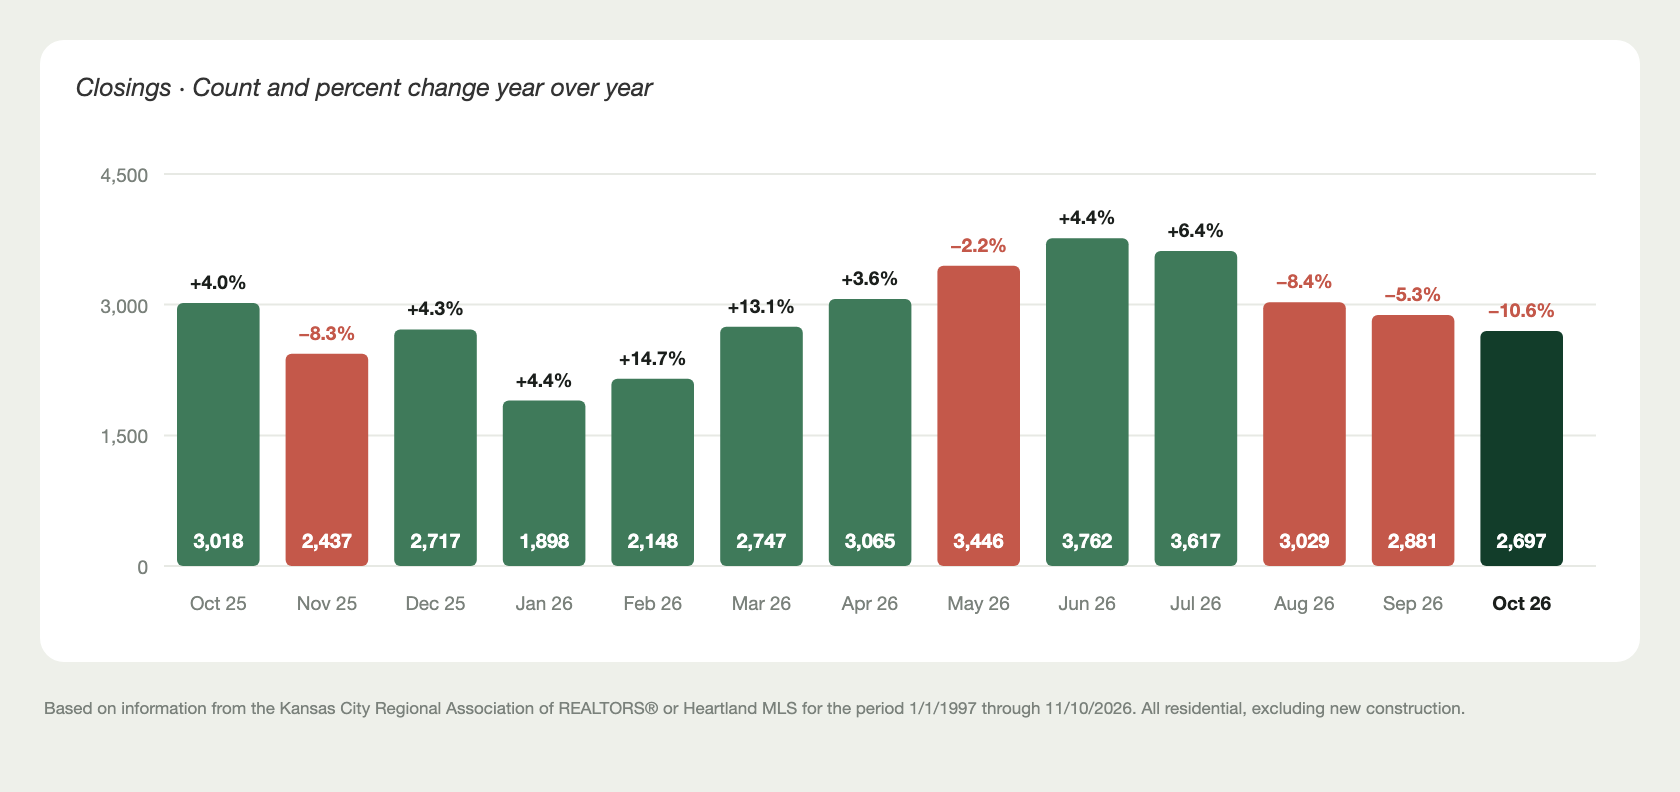
Closings: 2,697 (−10.6% YoY)
Pending sales: 2,622 (−12.4% YoY)
Contracts written fell 12.4% from October 2025, the fourth straight month below last year and the largest decline of 2026. From July through September the gap ran between 2% and 9%.
A note on how this number moves. Contract counts for a recent month tend to drift lower over the following weeks as some contracts fall through. September's count, first reported as 2,708, now stands at 2,617, which puts September at −8.5% rather than the −5.3% we published. October's figure is likely to drift the same way, so the true decline is at least as large as it looks today.
Closings followed the contract pipeline down, as the last two posts expected. Completed sales fell 10.6% from last October, the third month in a row below last year and the largest decline this year. For the year the market is still ahead, but only just: 29,290 closings through October against 28,970 at the same point in 2025, a gain of 1.1%. Through September that gain was 2.4%.
What this means for you
Sellers
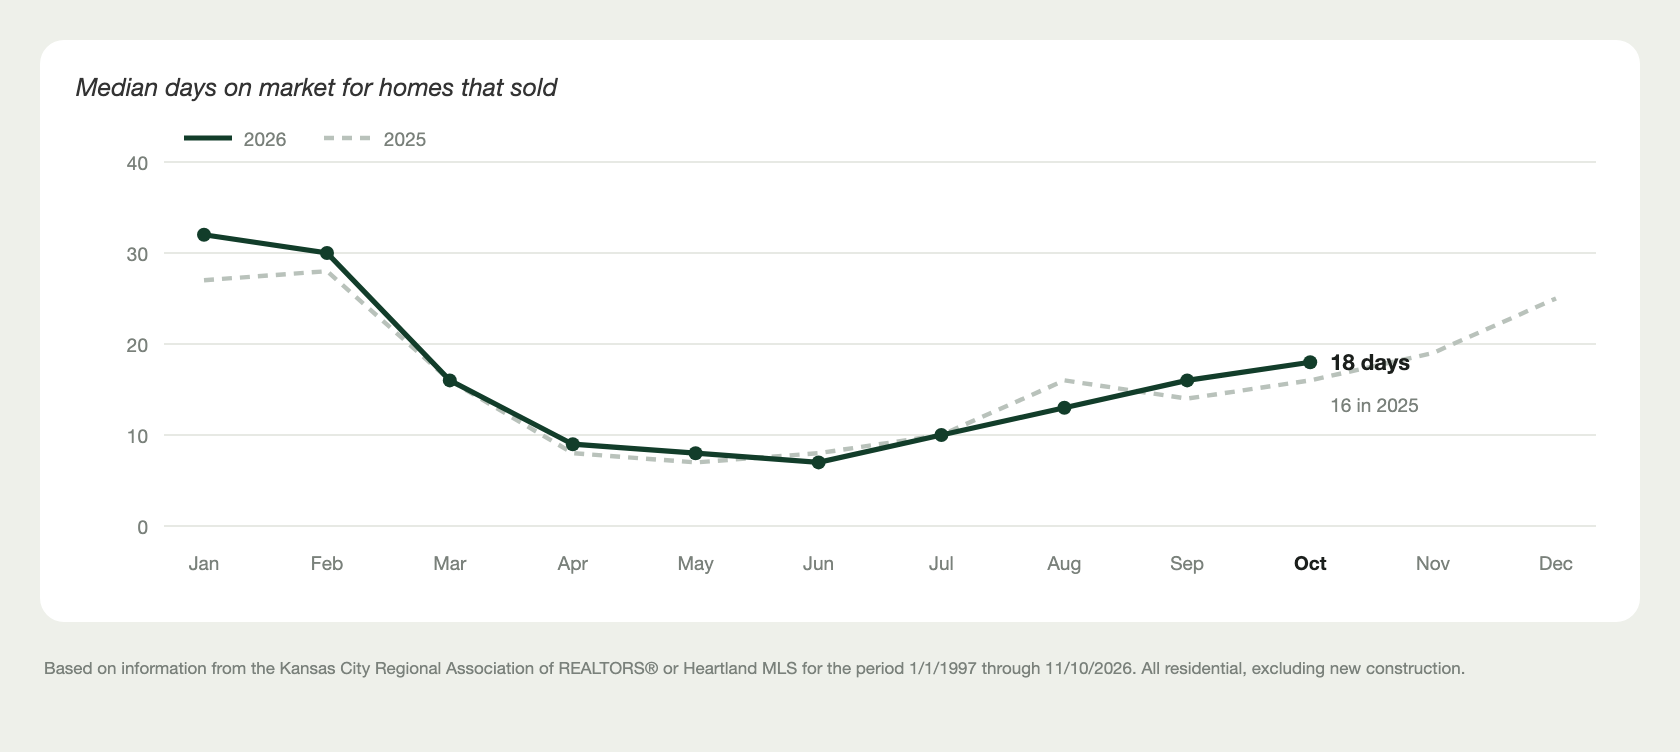
The year-over-year price cushion is gone, so a list price built on last spring's sales is likely to sit. The typical home that sold in October spent 18 days on the market, against 16 a year earlier, and the median home sold at 98.0% of its original list price. About 59% of October sales closed below the original list price, the same share as last October. Buyers are not discounting harder than they did a year ago. There are simply fewer of them, so the homes that are priced right still sell, and the ones that are not wait longer.
Buyers
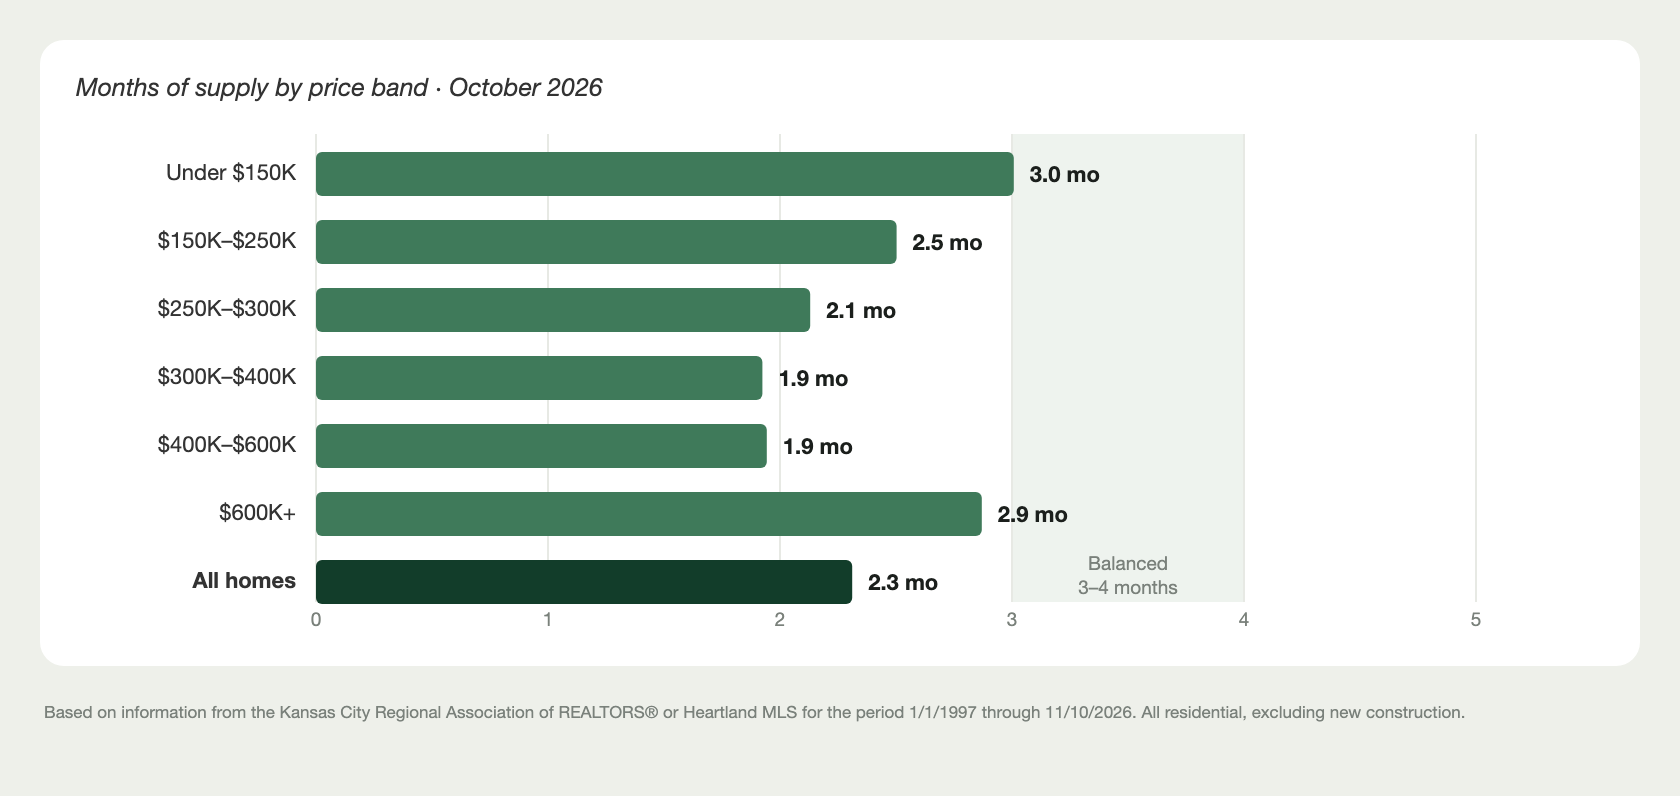
This is the most room buyers have had in a while. Prices are no longer rising year over year, contract activity is well below last year, and homes are taking a little longer to sell. The best opportunities are at the ends of the market: homes under $150,000 and above $600,000 have about three months of supply, close to balanced. The core $300,000 to $600,000 range is still tight at about 1.9 months, so well-priced homes there can still draw more than one offer.
Everyone
October extended the slowdown that began in July. New listings, contracts and closings were all below last year again, and this time by wider margins. The new piece is price: for the first time in more than three years, the median did not rise from the year before. That is a market leveling off, not one in decline. Supply is unchanged from September and still below balanced in every price band.
Headwinds: A thinner pipeline heading into winter
The contract pipeline is the clearest signal. Closings follow contracts by roughly 30 to 60 days, and October's contracts were 12.4% below last year. That points to November and December closings that are likely to finish well below 2025, and it puts the year-to-date gain in closings at risk of turning negative by year end.
Affordability is still the constraint behind the slower pace. At a $310,000 median, prices sit 26.5% above October 2021, and buyers need more income and a larger down payment than they did five years ago. Higher mortgage rates add to that gap.
Supply has stopped loosening. Metro-wide supply stands at about 2.3 months, the same as September, with 6,769 homes active. The $300,000 to $400,000 and $400,000 to $600,000 bands are the tightest at about 1.9 months each, followed by $250,000 to $300,000 at 2.1 months and $150,000 to $250,000 at 2.5. Homes under $150,000 sit at about 3.0 months and homes above $600,000 at about 2.9. No band has reached the three to four months that would signal a balanced market, but the two ends are close.
Kansas City's market is slowing, but it is not weakening on price. Fewer homes are listing, fewer are going under contract and fewer are closing, while prices have flattened rather than dropped. The question for November is whether contracts stabilize near this level or keep falling, because that will decide whether flat prices hold through the winter.
About these numbers: all residential resale homes in Heartland MLS, excluding new construction. Pending sales count each home in the month of its most recent contract date. Based on information from the Kansas City Regional Association of REALTORS® or Heartland MLS for the period 1/1/1997 through 11/10/2026.