
Market Pulse: September 2026
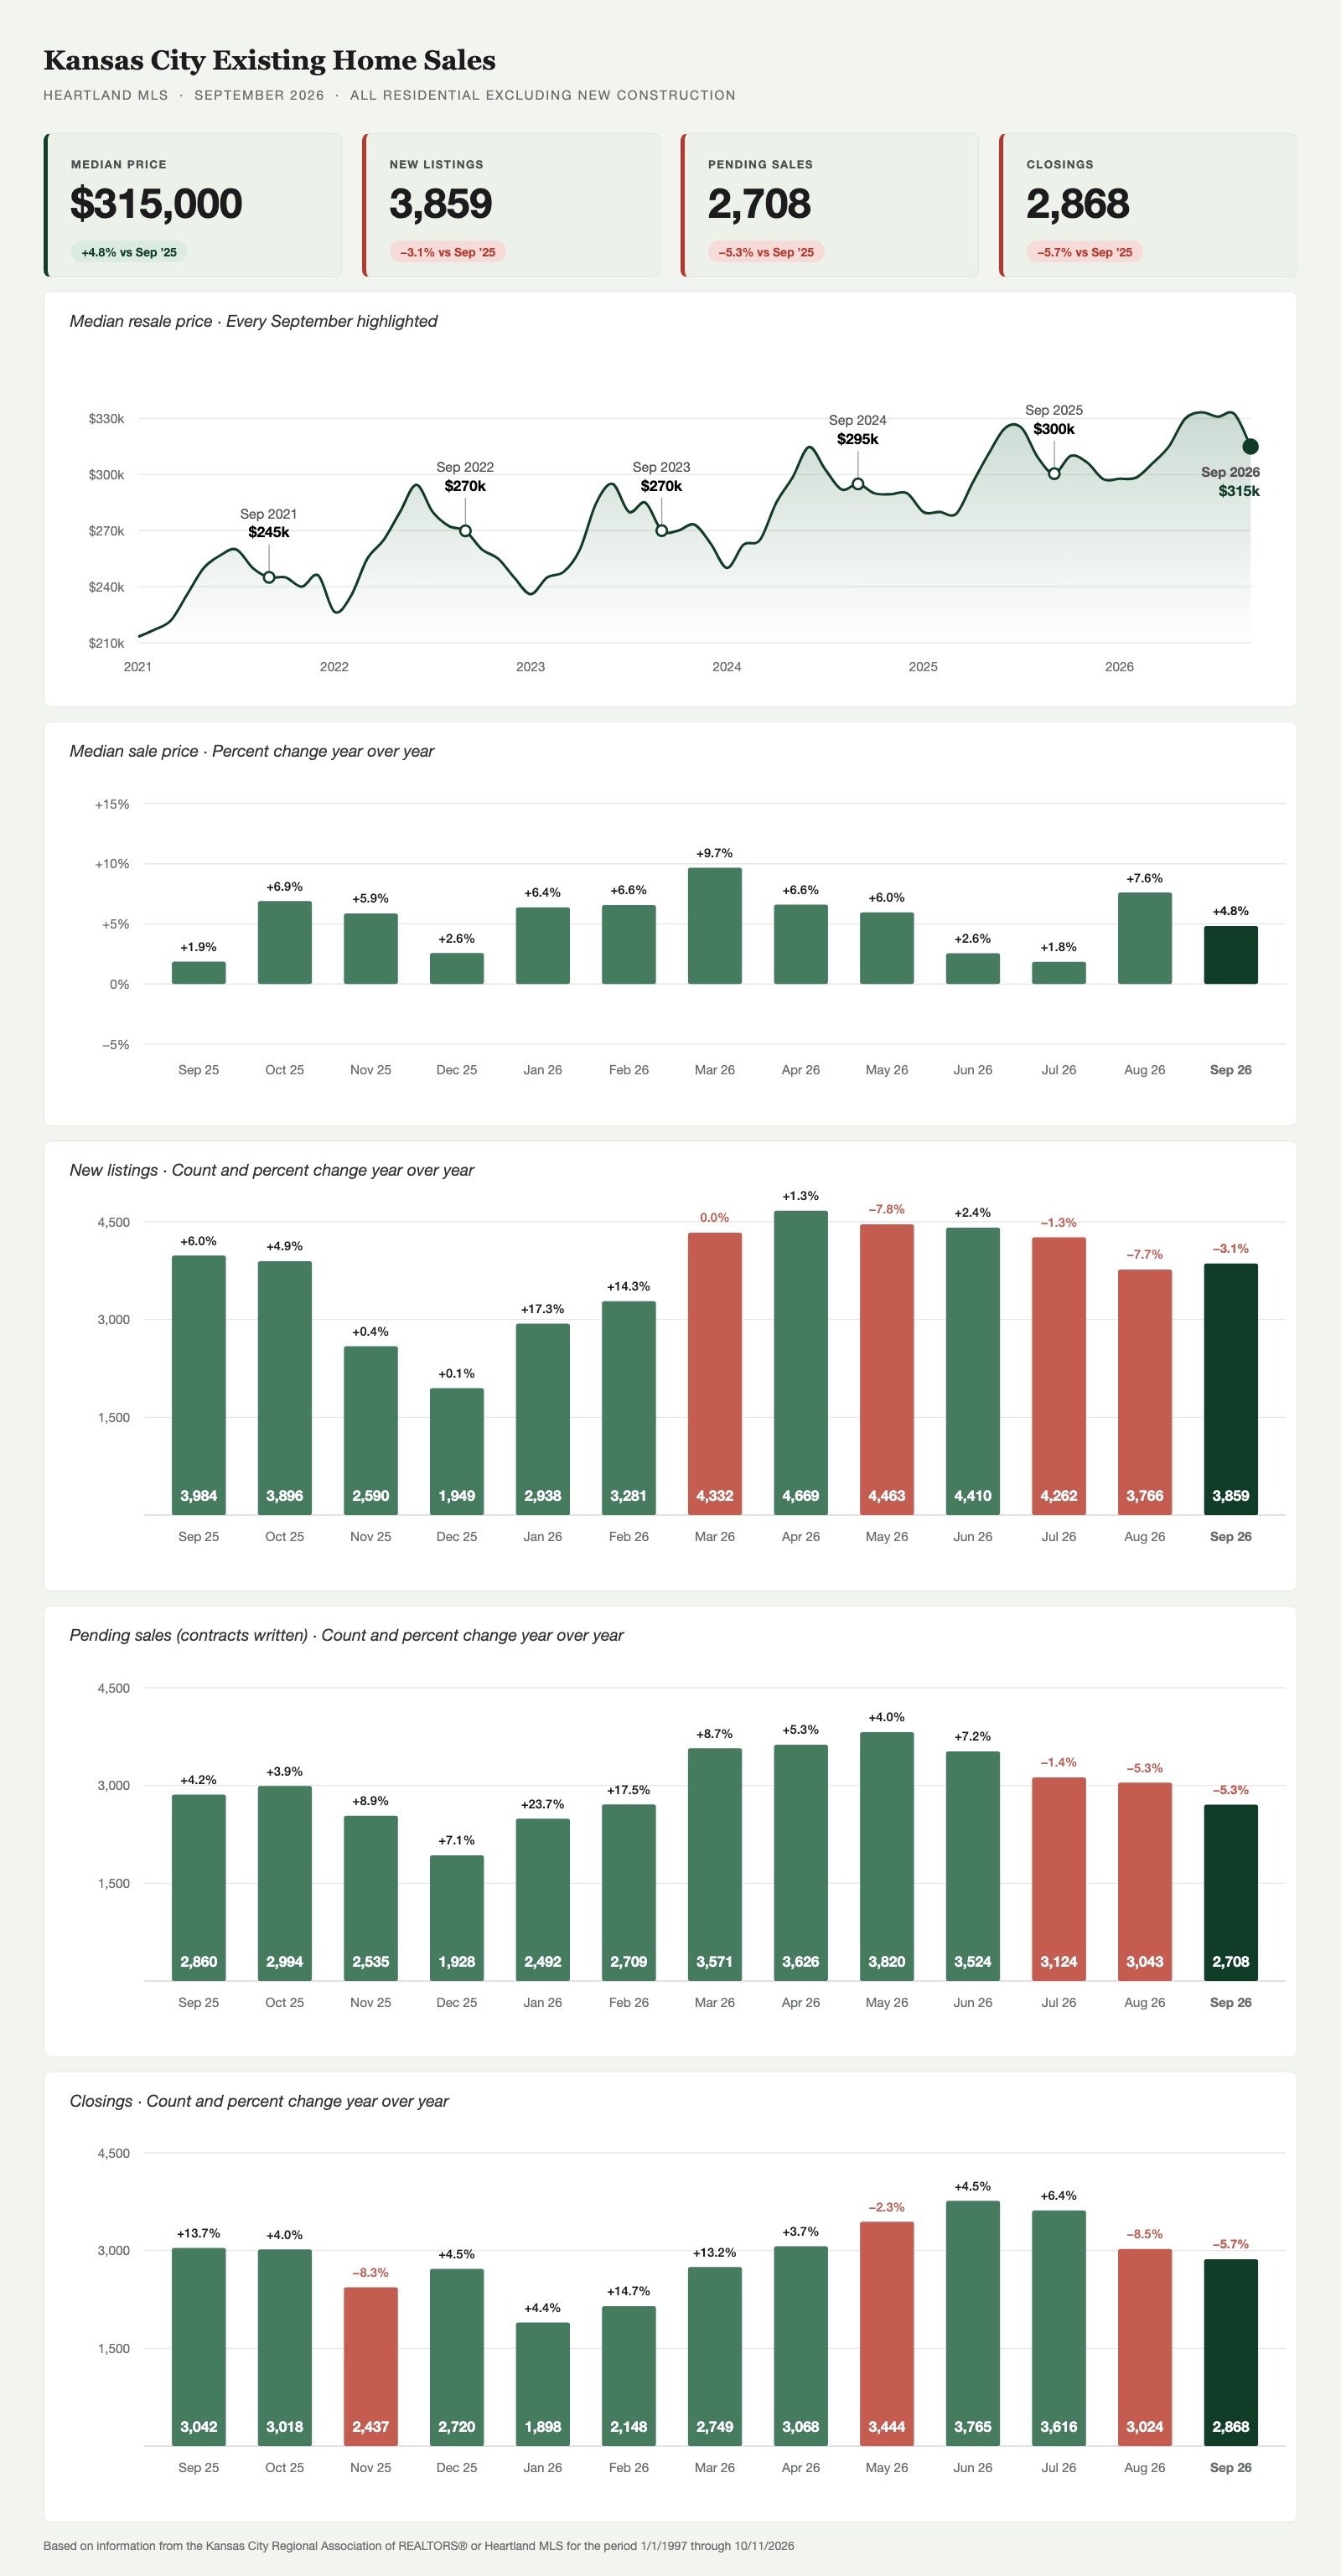
Kansas City's existing-home market stayed slower than last year in September. New listings, contracts written, and closings all finished below September 2025 for the second month in a row, though the drop in new listings narrowed. The median resale price was $315,000, down from August's summer high and 4.8% above last September.
In this article (8)
Market Pulse: September 2026
New Listings: The decline narrows
New listings: 3,859
Year over year: −3.1%
Fewer existing homes came to market than in September 2025, the third consecutive month of year-over-year declines. The gap is much smaller than August's, though. August finished 7.8% behind last year; September finished 3.1% behind.
September also broke from the usual seasonal direction. Listing volume normally drifts lower from August into September, and last year it fell by about 100 homes. This year it rose by about 100. Sellers who held back in late summer appear to have come to market in early fall, which gave buyers a little more to choose from than the August numbers suggested they would have.
Demand: Closings and contracts stay below last year
Closings: 2,868 (−5.7% YoY)
Pending sales: 2,708 (−5.3% YoY)
Completed sales fell 5.7% from September 2025, the second month in a row behind the prior year. August's post said the thinner contract pipeline pointed to softer closings in September and October, and September followed that script. For the year, the market is still ahead: 26,580 closings through September against 25,952 at the same point in 2025, a gain of 2.4%.
Contracts written declined 5.3% year over year, the same margin as August and the third straight month below last year. Contract activity has not fallen further, but it has not recovered either. Three months at this pace is a trend, not a pause.
What this means for you
Sellers
Prices are still above last year, but the summer peak has passed. The median resale price was $315,000 in September, down from $332,500 in August. A step down from summer into fall happens every year; this one was larger than last year's. Homes are also taking slightly longer to sell: the typical home that closed in September spent 16 days on the market, against 14 a year earlier. Pricing to the fall market, not to a neighbor's June sale, matters more now than it did three months ago.
Buyers
Selection held up better than expected and competition is lighter than a year ago. New listings rose from August while contract activity stayed more than 5% below last year. For a prepared buyer with financing in place, fall is offering more room to negotiate than spring did, particularly below $150,000 and above $600,000, where supply is loosest.
Everyone
September looked a lot like August on volume, with new listings, contracts, and closings all below last year for the second month running. Prices are the difference. The median is still 4.8% above September 2025, but that gain is smaller than August's 7.6%, and the monthly median has moved off its summer high. The market is transacting less and prices are no longer setting records, but they are not falling year over year.
Headwinds: A slower pipeline, affordability, and uneven supply
The clearest headwind is that the slowdown has lasted. July's weakness was confined to contracts. August spread it to listings and closings. September confirmed it: all three volume measures finished below last year again. One soft month can be noise. Two broad ones in a row, on top of three months of weaker contracts, are harder to dismiss.
Affordability remains the persistent constraint. At a $315,000 median, the market sits 29% above where it stood in September 2021, when the median was $245,000. Buyers need materially more income and down payment than they did five years ago, and elevated mortgage rates compound that gap.
Supply has eased, but unevenly. Metro-wide supply now stands at roughly 2.3 months, up from about 2.1 a month ago. The tightest segment is still the $300,000 to $400,000 range at about 1.8 months, with $250,000 to $300,000 and $400,000 to $600,000 both near 1.9 months. Both ends of the market are looser: homes under $150,000 sit at about 2.9 months and homes above $600,000 at about 3.0 months. Every band remains below the three to four months that would signal a balanced market, and the core price bands are well below it.
The contract pipeline also matters for what comes next. Closings follow contracts by roughly 30 to 60 days, so September's weaker contract volume points to October and November closings that are likely to finish below last year as well.
Kansas City's market is not deteriorating. Prices are above last year, year-to-date closings are still ahead of 2025, and supply in the core price bands is tight. But the fall is opening with fewer contracts and fewer closings than a year ago, and whether contract activity stabilizes in October is the trend worth watching.