
Rates, Not Jobs: What's Behind Kansas City's 2026 Slowdown
Kansas City sold fewer homes this summer, yet prices hit a record, unemployment fell and homes sold as fast as last year. What changed was the cost of money: the 30-year fixed rate bottomed just under 6% in February and crossed 7% this week, cutting roughly $30,000 from what the same monthly payment buys.
In this article (10)
Rates, Not Jobs: What’s Behind Kansas City’s 2026 Slowdown
Kansas City sold fewer homes this summer than last. August closings finished 8.9% below August 2025, contracts written fell 5.3%, and new listings dropped 7.8%. Those are real declines, and they arrived in a market where almost nothing else looks weak.
Prices set a record. Employment improved. Inventory barely moved. Wages rose faster than home prices. The one thing that changed materially in 2026 is the cost of borrowing — and it changed quietly, in increments, over seven months. This week it crossed 7%.
The rate move nobody announced
30-year fixed, Freddie Mac weekly survey, February 26: 5.98%
30-year fixed, Freddie Mac weekly survey, September 17: 6.95%
30-year fixed, Mortgage News Daily daily index, September 23: 7.26%
There was no single dramatic day. The 30-year fixed rate bottomed just under 6% in late February and has climbed almost every month since. On a monthly-average basis it moved from 6.05% in February to 6.81% in September, and the daily trackers have since pushed through 7%.
One note on the numbers, because they get quoted interchangeably and should not be. Freddie Mac publishes a weekly average; Mortgage News Daily publishes a daily index that normally prints above it. The gap between 6.95% and 7.26% is mostly methodology and timing, not a one-week spike. Compare each survey to its own history, which is what the chart below does.
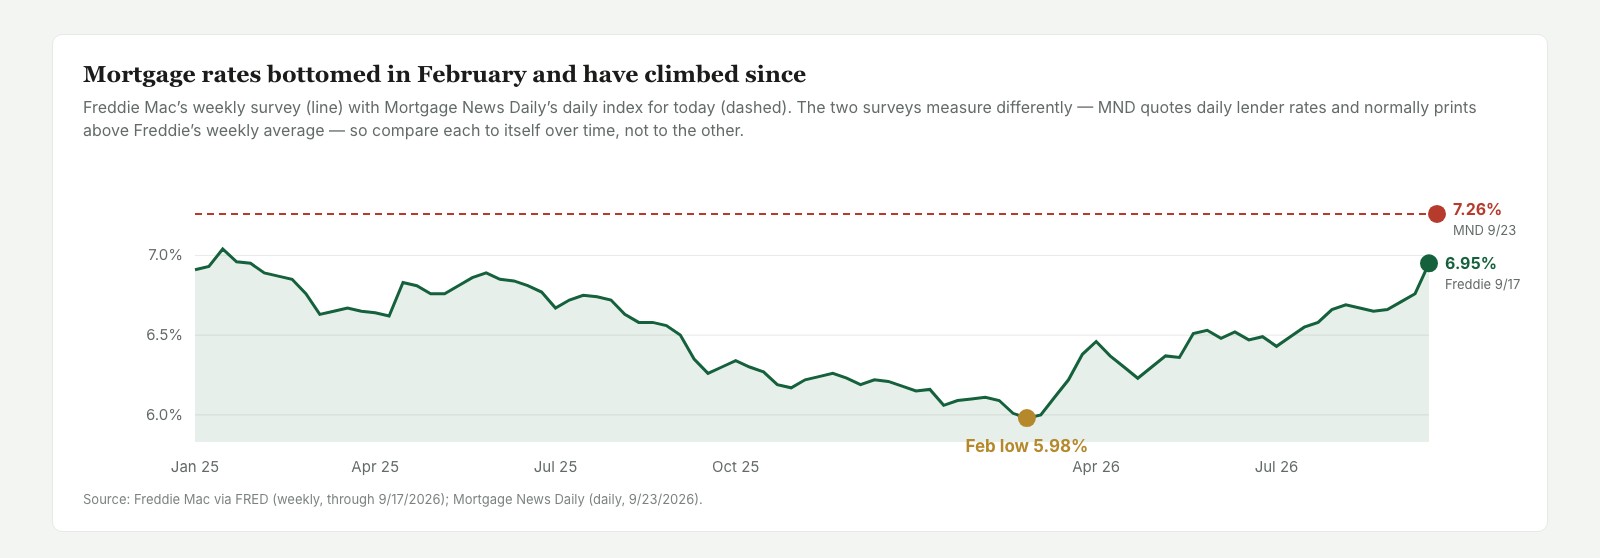
The timing matters more than any year-over-year comparison. A buyer who set a budget in February and is still shopping in September has not been operating in a stable market. They have been chasing a moving target.
What it costs: roughly $30,000 of buying power
Take the payment that bought Kansas City’s median home in February — $1,603 a month in principal and interest, 20% down on a $332,500 home. Hold that payment fixed and ask what it buys as rates climb.
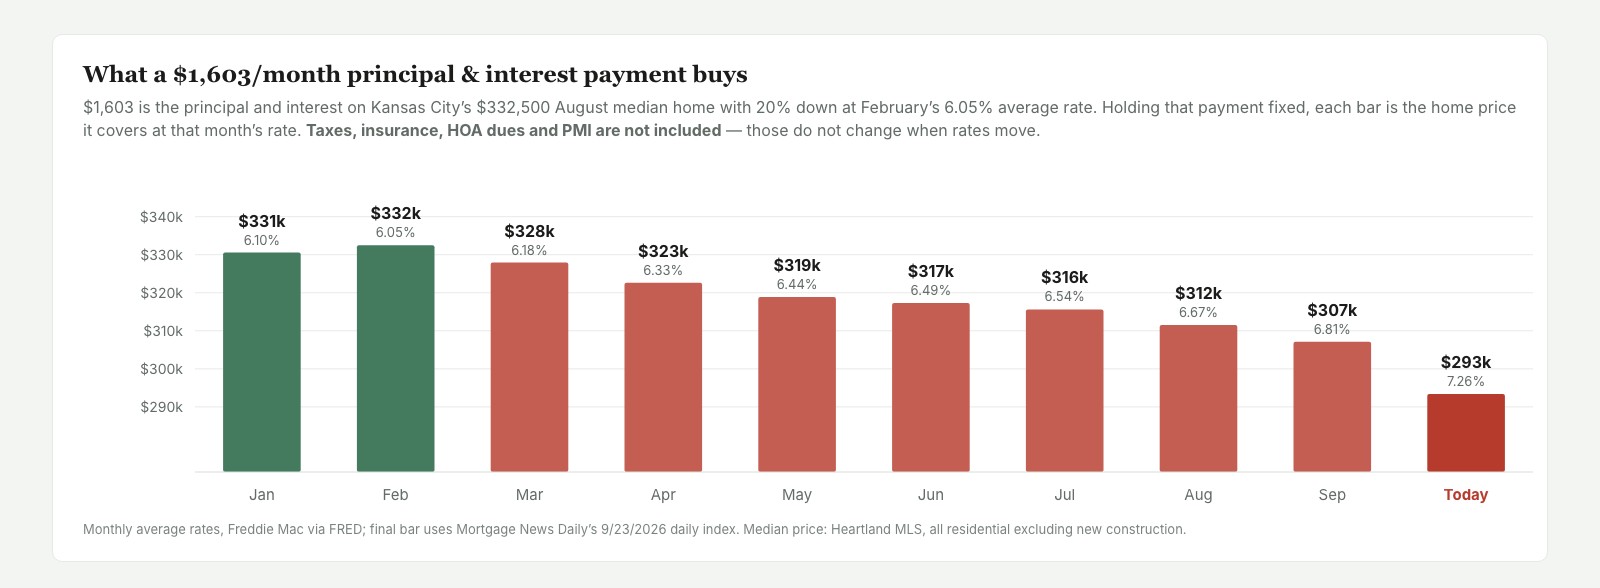
On a like-for-like Freddie Mac basis, February to mid-September, that payment lost about $29,800 of purchasing power. Measured against today’s daily quotes it is closer to $39,000. Either way the direction is the same, and the same $332,500 home now costs roughly $158 to $213 more per month than it would have in February.
There is a coincidence worth noticing. Buying power fell by roughly the same percentage that Kansas City’s median sale price rose — about 7.6% year over year, to $332,500. A buyer who spent 2026 waiting for prices to soften got neither cheaper homes nor cheaper money.
Why it’s the bond market, not your lender
Mortgage rates are often discussed as though banks set them. They largely do not. The 30-year fixed rate tracks the 10-year Treasury yield plus a spread, and in 2026 that relationship has been close to mechanical.
Since February the 10-year Treasury rose 77 basis points and mortgage rates rose 76. The gap between them held near 1.9 percentage points throughout. The 10-year closed at 4.96% on September 21, after touching 5.01% the week before — its first close at or above 5% in this cycle.
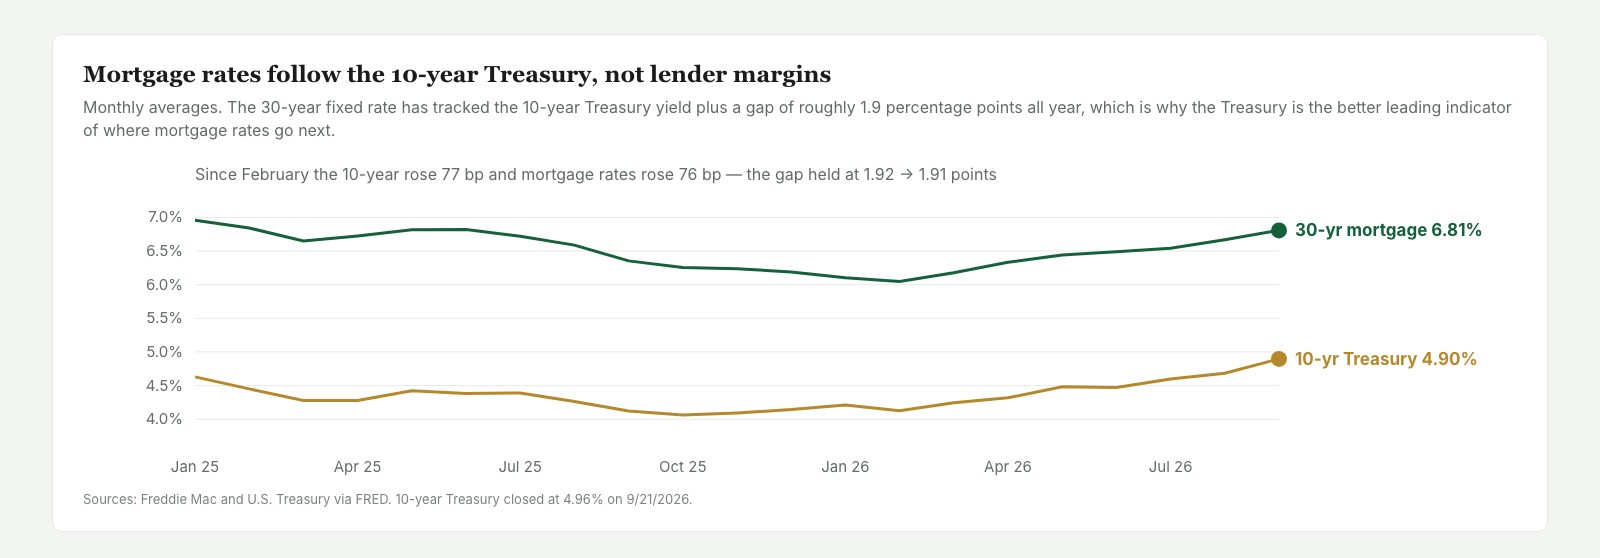
The practical consequence: if you want to anticipate where Kansas City mortgage rates are heading, watch the 10-year Treasury rather than lender advertising. Add roughly 1.9 points and you have a usable estimate.
The market is not weak. It is rationed.
A slowdown driven by weak demand looks different from one driven by payment math. In a weak market, homes sit longer, inventory piles up, price cuts spread, and job losses show up first. None of that is happening here.
Kansas City MSA unemployment: 3.6% in July, down from 3.9% in January
Median days on market: 50 days, identical to August 2025
Active listings: 6,284, down 0.4% from a year ago
Average hourly earnings: $36.37 in August, up 7.8% year over year
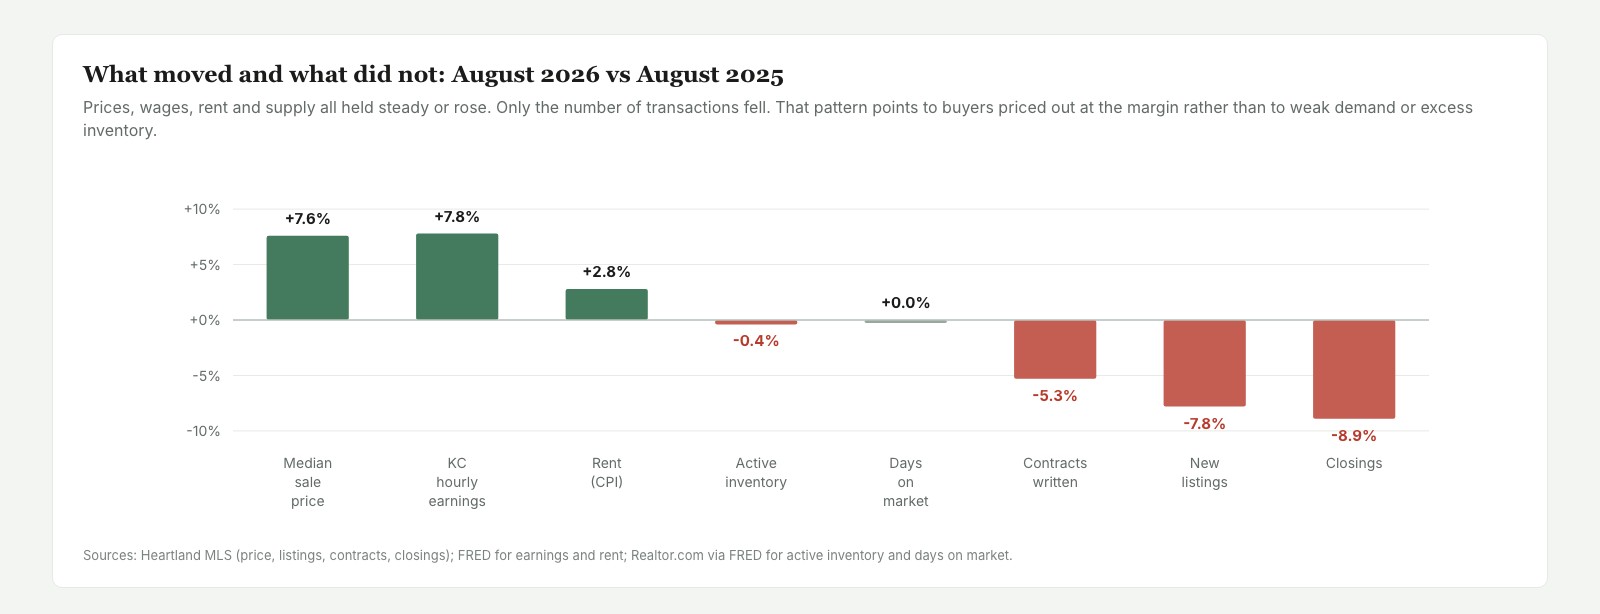
Homes are selling as quickly as they did last year. There is no inventory overhang. Local wages have grown slightly faster than the median sale price. What has fallen is the number of transactions — the count of households who can clear the payment hurdle at the moment they need to move.
That is rationing, not weakness. It also shows up in independent data: Realtor.com’s count of new listings across the Kansas City metro fell 4.4% year over year in August, a different geography and methodology pointing the same direction as our MLS figures.
What this means for you
Buyers
The cost of waiting is no longer obviously lower than the cost of acting. Over the past seven months, waiting cost roughly $30,000 in purchasing power while prices rose. That is not a prediction that rates will keep climbing — nobody knows — but it is a correction to the assumption that patience is free.
The practical lever is the payment, not the price. Rate locks, buydowns, adjustable products, and larger down payments all move the monthly number, and in a year like this one those tools matter more than they did in 2021. Settle the financing conversation before touring, because a budget set in spring may not survive to fall.
Sellers
Your buyer pool is smaller than last year, but your pricing power is intact. Prices are at records and homes are moving in 50 days, the same as last August. Nothing in this data says discount.
What it does say is that the marginal buyer is payment-constrained. That changes which concessions work. A rate buydown often buys more competitive advantage per dollar than an equivalent price cut, because it attacks the constraint that is actually binding. Pricing correctly at launch matters more than ever, since fewer buyers are circulating to discover an overpriced home later.
Investors
Two numbers moved in opposite directions this year, and both compress returns. Kansas City sale prices rose 7.6% year over year. Rent, measured by CPI rent of primary residence, rose 2.8%. Acquisition costs are outrunning rent growth, which tightens yields on new purchases.
Financing cost rose alongside. With owner-occupied 30-year money now quoted above 7% — and non-owner-occupied higher still — leveraged deals that penciled in February need rent assumptions or purchase prices that many sellers are not yet entertaining, because sellers are still getting record prices from owner-occupants.
The offsetting factor is competitive position. When financed buyers are payment-constrained and the seller pool is not capitulating, buyers who are less rate-sensitive face relatively less competition per property. That is a real advantage, though it does not by itself make a marginal deal work.
What to watch
Three indicators will tell you which way the next two quarters break, and all three are public.
The 10-year Treasury is the leading indicator for mortgage rates, and the 1.9-point rule of thumb has held all year. Days on market is the first place genuine demand weakness would appear — at 50 days it has not moved, and a climb toward 60 would signal something the transaction counts alone cannot distinguish. Kansas City employment is the foundation under current prices; at 3.6% unemployment and improving, it is the reason this looks like an affordability story rather than a downturn.
Kansas City’s market in 2026 is not a market in trouble. It is a market where the cost of money moved faster than anything else, and where fewer households could act as a result. If the 10-year retreats, the payment math loosens quickly, and the transaction count is the first thing that should recover.
Rate figures are current as of September 23, 2026. Kansas City sales figures are from Heartland MLS, all residential excluding new construction, as reported in our August Market Pulse; monthly counts revise slightly as late sales report.