
September Is Slow. That's Normal.
September contracts are pacing about 4% behind last year, but 2026 is still 5.5% ahead year to date. September has never been a big month, and this one is following the usual seasonal curve.
In this article (7)
September Is Slow. That's Normal.
Contracts in Kansas City dropped again this month, and if you only look at September, it can feel like the market is running out of steam. It is not. September is just September.
Everything here covers single family homes in the Kansas City metro, resale and new construction together, from Heartland MLS.
Where September is landing
Through September 29 there were 2,645 single family contracts written. With one day left, the month will finish around 2,736. September 2025 finished at 2,848 and September 2024 at 2,756. So this year is about 4% behind last year and right on top of two years ago.
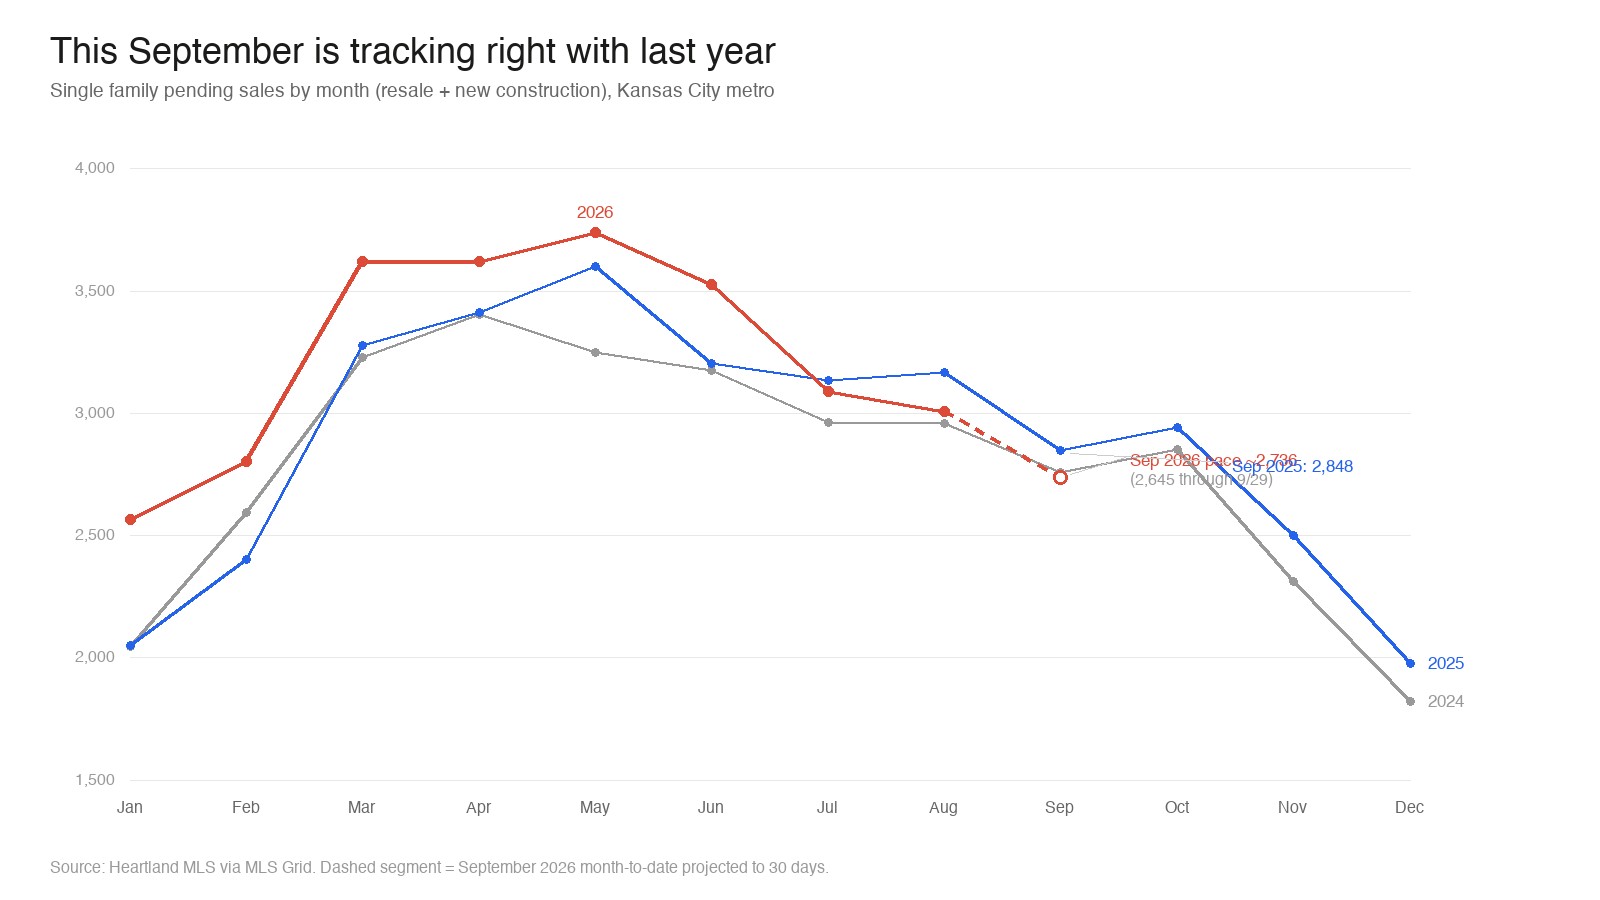
The bigger picture is better. Through September, 2026 has 28,595 contracts. That is 5.5% ahead of 2025 and 8.4% ahead of 2024. January through June ran well above both years, and that cushion is still there.
September was never a big month
I averaged every year from 2015 to 2025 and looked at how much of the annual total lands in each month. September comes in at 8.0%. April and May are each about 10%. Only December, November, January and February are smaller.
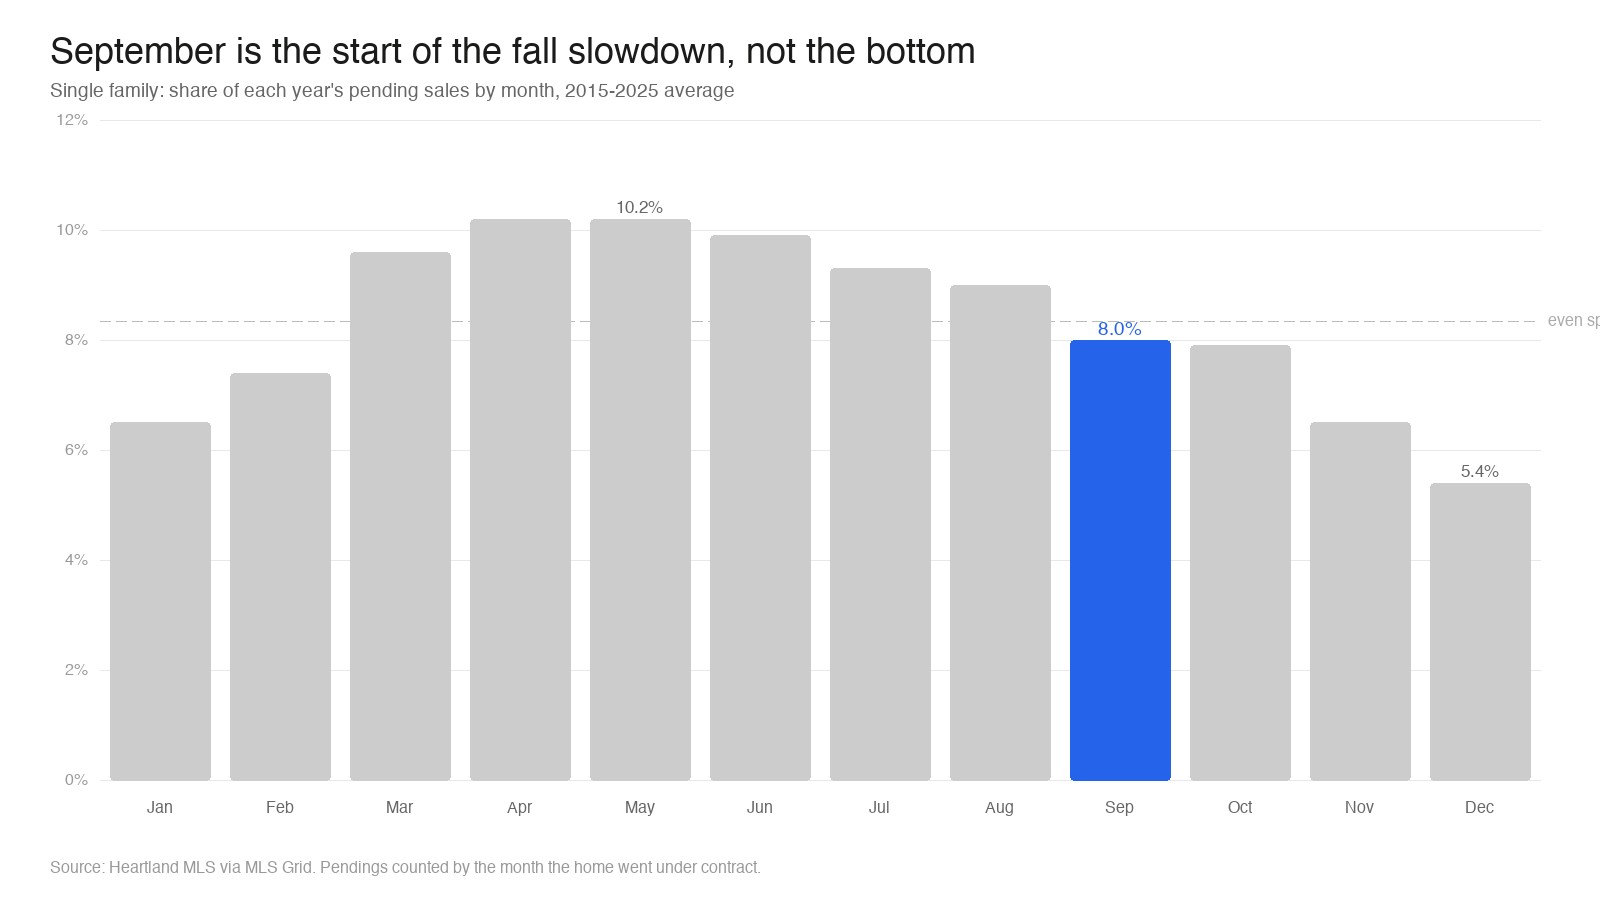
September is also not the bottom. October is nearly identical at 7.9%. The real drop comes in November (6.5%) and December (5.4%). Add up September through December and you get about 28% of the year. The other eight months do the other 72%.
So a soft September tells you very little about the year. By the time it shows up, the year has mostly been decided.
Closings
Closings trail contracts by 30 to 45 days, so they show what happened in the summer. Through September there have been 26,426 closings, essentially flat with 2025 (26,338) and 4.1% above 2024 (25,376). June was the best month since 2022 at 3,726.
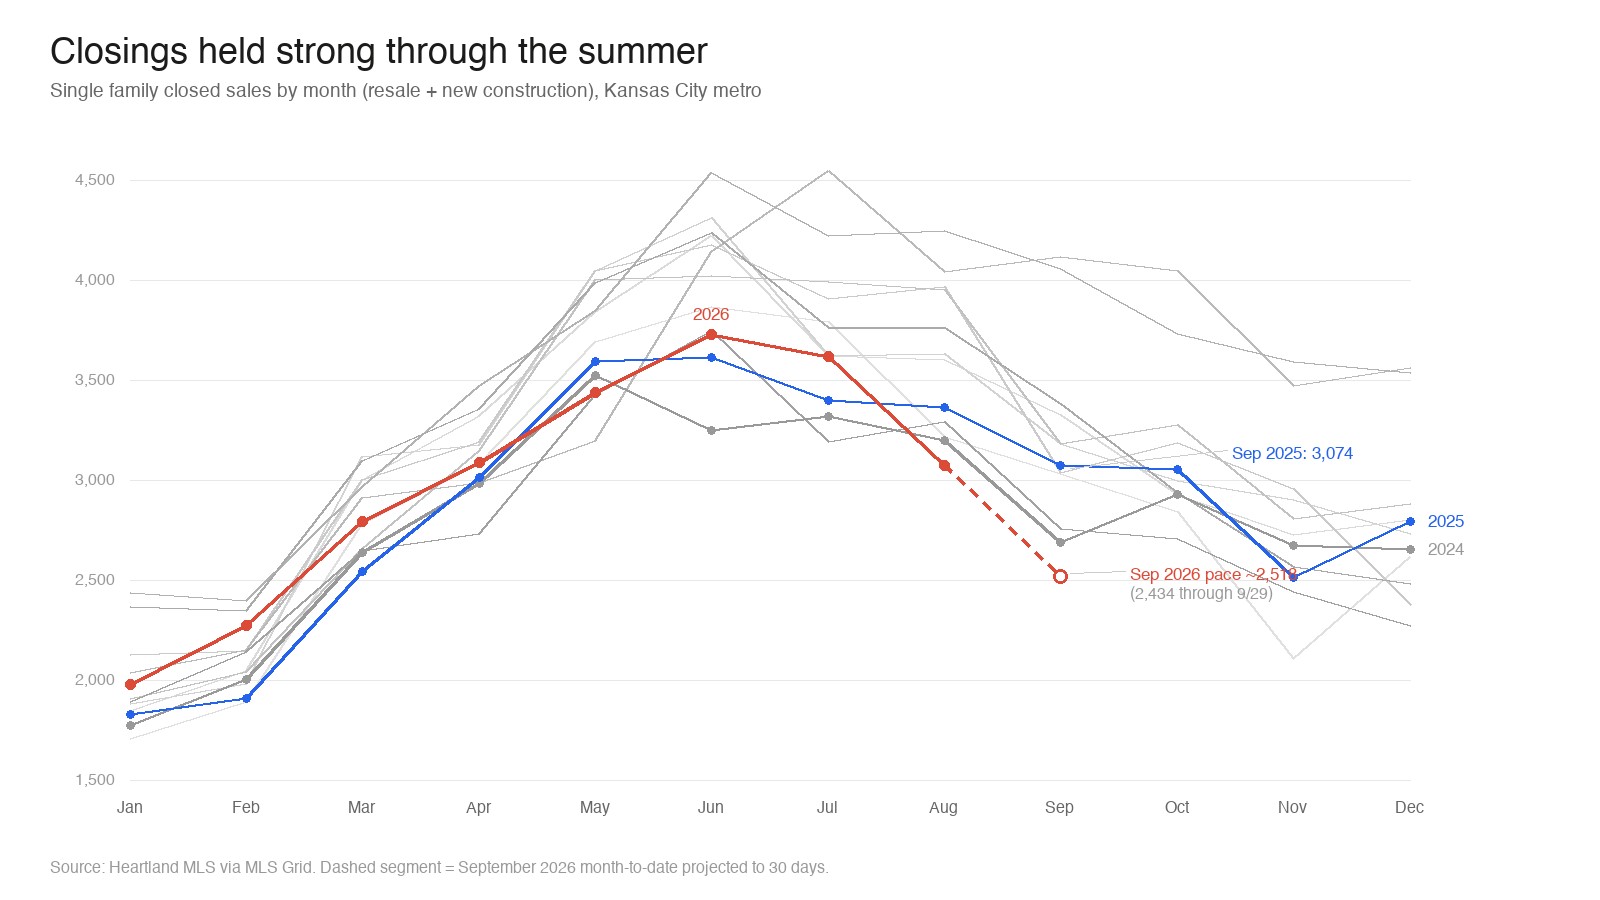
The gray lines are 2015 through 2023, and they all have the same shape: a climb into May or June, a peak, then a slide through fall. 2020 and 2021 were the only years that broke it. 2026 is following the pattern.
The September closing count (2,434 so far, pacing to about 2,518) looks well behind last September's 3,074. I would not read too much into that yet. Closings from late-September contracts keep getting recorded into October, and I will recheck it next month.
If you are buying
Most buyers do their shopping in spring. By October there are fewer people looking at the same houses, and the ones still listed have already sat through the busy season. That gives you a little more room to negotiate than you had in May. It does not mean prices fall. It just means less competition.
The rate question is separate, and it is the bigger one. I covered what 7% is doing to buying power in last week's post.
If you are investing
Be careful with fourth quarter comps. Fewer homes close in November and December every year, so a Q4 comp set is thinner and can look weaker than the same house would in June. That is seasonality, not a price move. When you underwrite, use the trailing 12 months and do not lean on the last two or three.
What I am watching
October contracts. The last two Octobers landed at 2,853 and 2,944. If this one comes in near that range, the seasonal story holds and 2026 ends as an above-average year. If it falls well below, that is new information.
I will also be watching whether closings hold up through October and November. If they do not, that points back to rates.